
Writing · Running
Get faster by running slower: what two VO2 max tests taught me about heart rate zones
The most useful number from my VO2 max test was not my VO2 max. It was the heart rate at which my breathing first changed.
The most useful number from my VO2 max test was not my VO2 max. It was the heart rate at which my breathing first changed.
Before the test, running metrics felt like three languages that nobody had translated. My watch showed five heart rate zones. Training plans talked in paces: easy pace, tempo pace, 10 km pace. Everyone online talked about “80/20”. I followed each one separately and never saw how they connected.
They connect through two points in your breathing. Once I had those two points measured, the zones, the paces and the 80/20 rule turned into one picture.
What the test actually measures
A VO2 max test is simple. You run on a treadmill with a mask over your face. Every few minutes the speed goes up. The mask measures how much oxygen you take in, how much carbon dioxide you breathe out, and how much air you move per minute. You keep going until you cannot.
The headline number, VO2 max, is the ceiling: the most oxygen your body can use per kilogram per minute. It is a good number to have. It does not tell you how to run tomorrow.
The two numbers that change how you train sit below the ceiling. They are the ventilatory thresholds.
- VT1, the first ventilatory threshold. The point where your breathing first starts to rise faster than your oxygen use. Below it, you can talk in full sentences. It sits close to what coaches call the aerobic threshold.
- VT2, the second ventilatory threshold. The point where your breathing rises steeply a second time, because acid is building up in your muscles faster than you can clear it, and your body breathes harder to blow off the extra carbon dioxide. Above it, you manage a few words at a time. For a trained runner it is roughly the pace you could hold for an hour.
I did two tests at The Mill, seven weeks apart. In August, my VT1 was 131 bpm at 7:09 per km. My VT2 was 159 bpm at 5:13 per km. (All my paces are flat equivalents. The Mill runs the test at a 3% incline and converts the speeds.)
That is a gap of almost two minutes per km between the two thresholds. It is also the most important thing the test told me.
Why the zones on my watch never made sense
Watch zones are usually percentages of an estimated maximum heart rate. The common estimate, 220 minus your age, can be wrong by 10 bpm or more for a given person. And even with a correct maximum, a percentage does not know where your thresholds are. Two runners with the same maximum can have VT1 at very different heart rates.
That is why “Zone 2” meant different things to different people. It is a band on a five-zone scale, and the band only means something when it is anchored to your thresholds.
The Mill builds its zones from VT1 and VT2. My Zone 2 is 118 to 131 bpm, which ends exactly at VT1. In pace, that is 7:14 to 7:59 per km. That is what easy means for me.
The test swaps the guess for two measured points, and every useful zone hangs off them:
| Zone | Where it sits | What it feels like |
|---|---|---|
| Easy | Below VT1 | Full sentences. Could go for hours |
| Grey zone | Between VT1 and VT2 | Comfortably hard. Short phrases |
| Hard | Above VT2 | A few words. Minutes, not hours |
When people say “Zone 2 training”, the useful version is running just under VT1. “Sub-Zone 2” is the same idea with a margin for error: stay a few beats below VT1 so heat, hills and a bad night’s sleep do not push you over it.
What seven weeks changed
Put pace along the bottom and heart rate up the side. Every runner has a curve on this chart: how hard your heart works for a given pace. Here are mine from both tests.
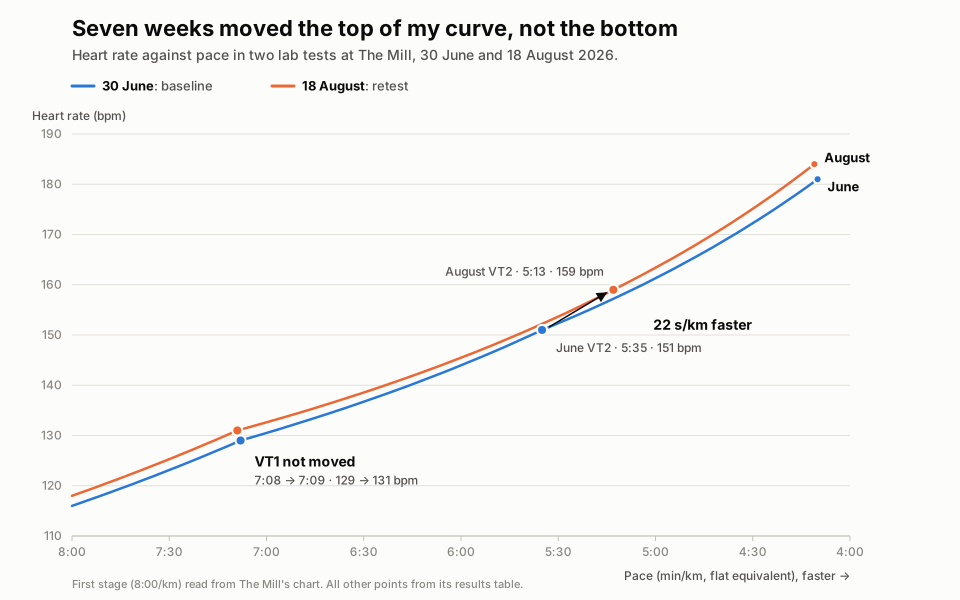
The top of the curve moved. VO2 max went from 57.5 to 61.3 ml/kg/min. About a quarter of that came from being 1.4 kg lighter. The rest was real: my body used 5% more oxygen at its peak. VT2 moved 22 seconds per km faster, from 5:35 to 5:13, and its heart rate rose from 151 to 159 bpm. I can now run faster and harder before my breathing tips over.
The bottom did not move. VT1 went from 129 bpm at 7:08 per km to 131 bpm at 7:09 per km. That is the same point, inside the normal day-to-day noise of a heart rate reading.
That surprised me, and then it made sense. The ceiling responds to training in weeks. The aerobic base takes months.
The lever: same heart rate, faster pace
The base is where the lever sits. Heart rate is the cost. Pace is what you get for it. Easy running does not lower the cost of running hard so much as it moves the whole curve to the right, so the same heart rate buys a faster pace.
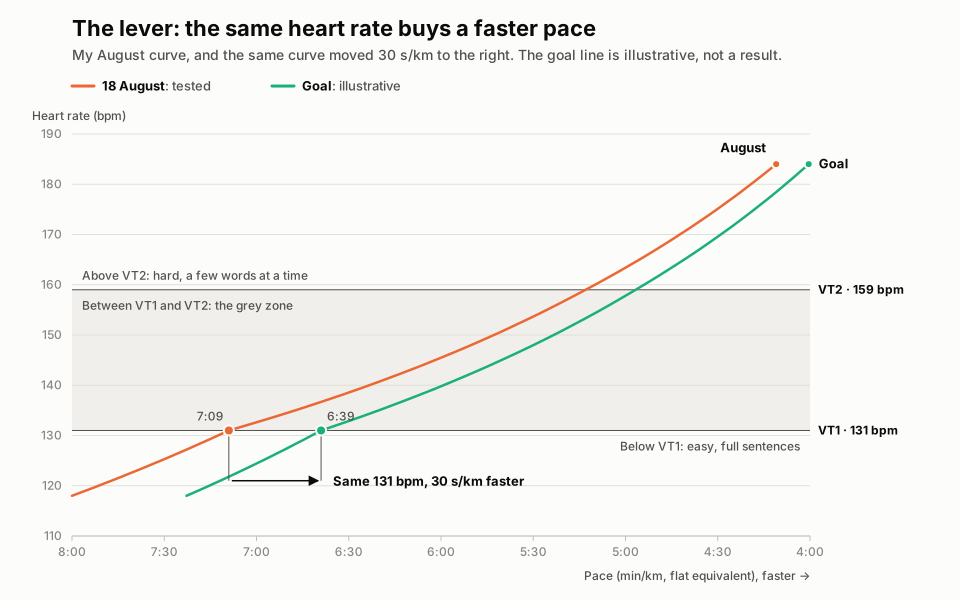
The mechanism is not mysterious. Hours below VT1 build more mitochondria in the muscle (the parts of the cell that burn fuel with oxygen), more capillaries to deliver blood to them, and a heart that pushes out more blood per beat. Each beat buys more speed.
My two-minute gap between VT1 and VT2 is the room this lever has to move. The top end is already strong. The base is not yet.
So the number I now track is not race time and not VO2 max. It is pace at VT1 heart rate. After seven weeks it had not moved. If it gets faster over the next few months, the training is working, whatever my last race said.
The 80/20 pyramid
The 80/20 rule comes from Stephen Seiler, an exercise physiologist who studied how elite endurance athletes actually train. Across rowing, cross-country skiing, cycling and running, he found the same shape: about 80% of sessions below VT1, and the other 20% at or above it.
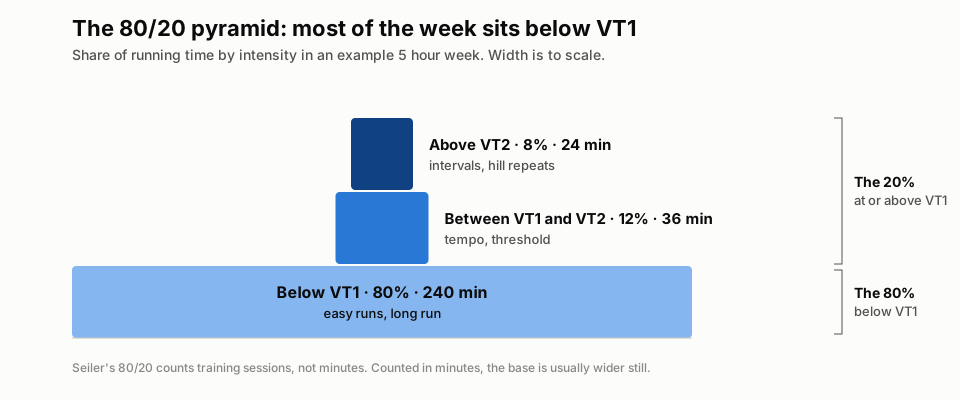
For a 5 hour week, that is 4 hours easy and about an hour of harder running, split across one or two sessions. The pyramid is a good way to think about it because the width of the base limits how high the top can go. The easy running builds the curve shift. The hard sessions sharpen what the base can support.
Most recreational runners build the opposite shape. Almost every run lands in the grey zone: too hard to count as easy, too easy to count as a real workout. Even the names work against you. The Mill labels my grey zone, 131 to 151 bpm, “Endurance”. It feels productive because it is tiring. But it leaves you too flat for proper hard days, and it does not pile up the volume that moves the curve.
The best argument against
If you only run three or four hours a week, spending 80% of it slow feels like a waste. And there is real evidence behind that worry. Hard intervals raise fitness quickly in people who are new to training, often within a few weeks.
That is true, and it is the reason the grey zone is so tempting. The answer is what happens after those first weeks. Gains from intensity level off quickly. Gains from easy volume keep coming for months and years, and easy running lets you keep adding volume without breaking down. Studies of recreational runners point the same way: in a 2014 study of 30 recreational 10 km runners by Muñoz, Seiler and colleagues, both groups improved over 10 weeks, but the group that trained polarised (mostly easy, some hard, very little in between) improved more. Among the runners who stuck closely to their plan, the polarised group ran 7.0% faster and the between-thresholds group 1.6% faster.
The rule also scales down. On a small week, 80/20 still means one or two sessions with real intent and everything else genuinely easy. What it rules out is a week of medium runs.
What heart rate cannot tell you
Heart rate is a good guide, not an exact one. A few things caught me out.
- It lags. On a 400 m rep, your heart rate is still climbing when the rep ends. Use pace or effort for short intervals.
- It drifts. On a long run, especially in heat, heart rate climbs at the same pace as you dehydrate and warm up. Slow down to hold it under VT1. Do not chase the pace.
- Wrist sensors are noisy. A chest strap is far more reliable, especially in the first 10 minutes and on intervals.
- Thresholds move. My VT2 heart rate rose 8 bpm in seven weeks. Zones set from an old test go out of date. Retest every few months, or use a field test in between.
- A lab curve is a snapshot. Heat, sleep, caffeine and stress all shift heart rate by a few beats from day to day. A 2 bpm change between two tests is noise. Compare like with like.
What I do now
- Easy runs sit a few beats under VT1, no matter how slow that feels.
- One or two sessions a week are genuinely hard, above VT2 or at threshold.
- Once a month I run the same flat loop at VT1 heart rate and record the pace. That single number is my progress chart.
It took two lab tests to show me where the work is. The fast end of my curve is already moving. The slow end is the one that needs time, so I now expect most of my running to feel too easy.